

Insights to the tastiest bits…
Australian Property Market Update: Is the Housing Market Cooling? What Home Buyers and Investors Need to Know
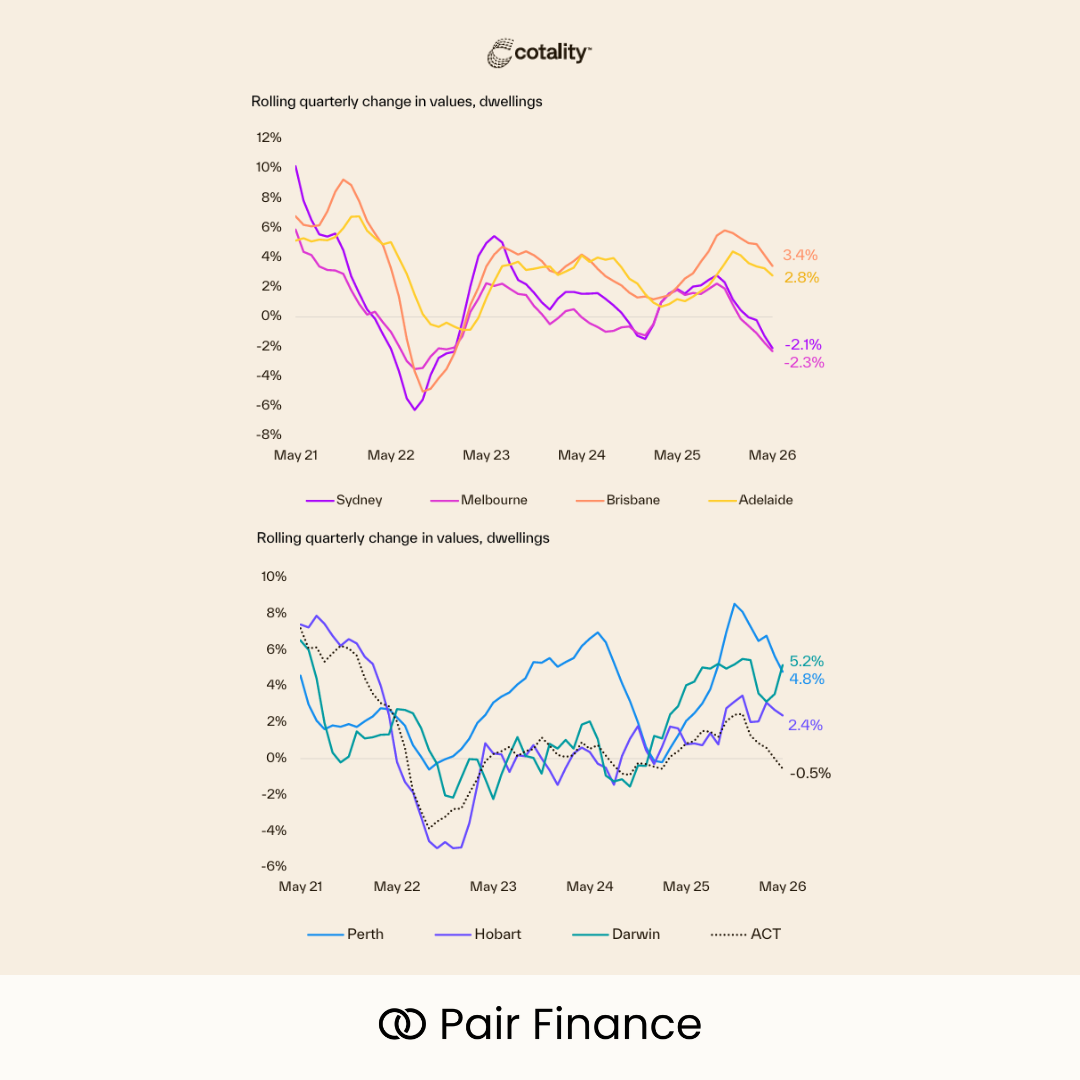
According to Cotality's June 2026 Housing Chart Pack, home values are still rising, up 8.8% over the past year, but the pace has slowed considerably, with growth of just 0.6% over the past three months. In other words, property prices are still moving forward, just not at the sprint we've become used to.
The biggest surprise is how differently each market is behaving. Sydney and Melbourne are taking a breather, recording quarterly declines of 2.1% and 2.3% respectively, while Darwin continues to power ahead with quarterly growth of 5.2%. Perth (4.8%), Brisbane (3.4%), and Adelaide (2.8%) aren't far behind, all sitting at record highs and proving that not every city got the memo about slowing down.
Regional Australia is also quietly outperforming the capitals, and units are increasingly stealing the spotlight from houses in several cities as buyers chase affordability. It's a reminder that the property market isn't one big national story anymore—it's a collection of very different local stories.
One thing hasn't changed: Australians remain deeply invested in property, with residential real estate now worth $12.6 trillion and accounting for more than half of household wealth.
Source: Cotality
June 2026
RBA Keeps Cash Rate on Hold at 4.35%
The Reserve Bank of Australia has kept the official cash rate unchanged at 4.35%, pausing after three rate increases earlier this year.
For borrowers, this pause is welcome news — but it does not necessarily mean interest rates are on the way down yet.
Inflation remains the RBA’s key concern, and the Board has made it clear that further rate increases are still possible if inflation remains persistent.
We are also starting to see the impact of higher interest rates across the economy. Consumer spending has slowed, financial conditions have tightened, and housing market momentum has softened. Over the quarter, dwelling values declined by 0.9% in Sydney and 1.5% in Melbourne, reflecting reduced borrowing capacity and more cautious buyer sentiment.
Source: RBA
June 2026
RBA has put up the rate by 0.25% in February 2026
The RBA has lifted the cash rate by 0.25%, from 3.60% to 3.85%.Inflation is still running too high, and the economy has been stronger than expected — people are spending, businesses are investing, and jobs remain tight. This rate rise is aimed at cooling things down and keeping inflation in check. Future decisions will depend on how inflation, jobs and the economy track from here.
Source: RBA
February 2026
RBA keeps cash rate on hold at 3.60% in November
The RBA kept the cash rate at 3.60%. Inflation has come down a lot since 2022, but the latest quarterly figure was higher than they expected. Part of that was due to one-off factors like electricity rebates ending, but it also shows price pressures aren’t completely gone.
At the same time, the economy is picking up again – spending is improving, housing is stronger, and the labour market is still reasonably solid.
There are also uncertainties around demand and supply in the economy, the jobs market, and productivity. These could push inflation or employment in either direction.
Because of that, the RBA decided to stay cautious and leave the cash rate unchanged.
November 2025
Great news! The RBA has cut the cash rate to 3.6% for August
The Reserve Bank has reduced the cash rate by 0.25% at its August meeting – the 3rd cut this year, following reductions in February and May. This brings the cash rate down to 3.60%, the lowest level since April 2023.
With inflation easing in the June quarter, today’s move was widely anticipated. If your bank passes on the cut in full, your variable home loan repayments will go down. It can also mean sharper offers for new lending and an increased borrowing capacity.
August 2025